With Finance Minister Nirmala Sitharaman set to present the Union Budget 2026-27 on February 1, 2026, at 11 AM, industry leaders from AI-driven health-tech, medical apparel manufacturing, construction equipment, senior living, co-working spaces, and fuel delivery are calling for targeted incentives, regulatory clarity, and sustained support to drive innovation, workforce development, affordability, and last-mile infrastructure.
external_url=https://economicedge.in/union-budget-2026-ai-health-tech-medical-apparel-construction-equipment-senior-living-co-working-fuel-delivery-leaders-seek-incentives-and-policy-reforms/
Blog
-

Union Budget 2026: AI Health-Tech, Medical Apparel, Construction Equipment, Senior Living, Co-Working & Fuel Delivery Leaders Seek Incentives and Policy Reforms
-
Enalytix Expands AI Video Intelligence to Enhance Crowd Safety in Religious Infrastructure
Enalytix has announced its expansion into technology solutions for temples and religious venues, addressing the challenge of managing massive, high-density footfall that is still largely handled through manual systems.
external_url=https://cxotoday.com/media-coverage/enalytix-expands-ai-video-intelligence-to-enhance-crowd-safety-in-religious-infrastructure/ -
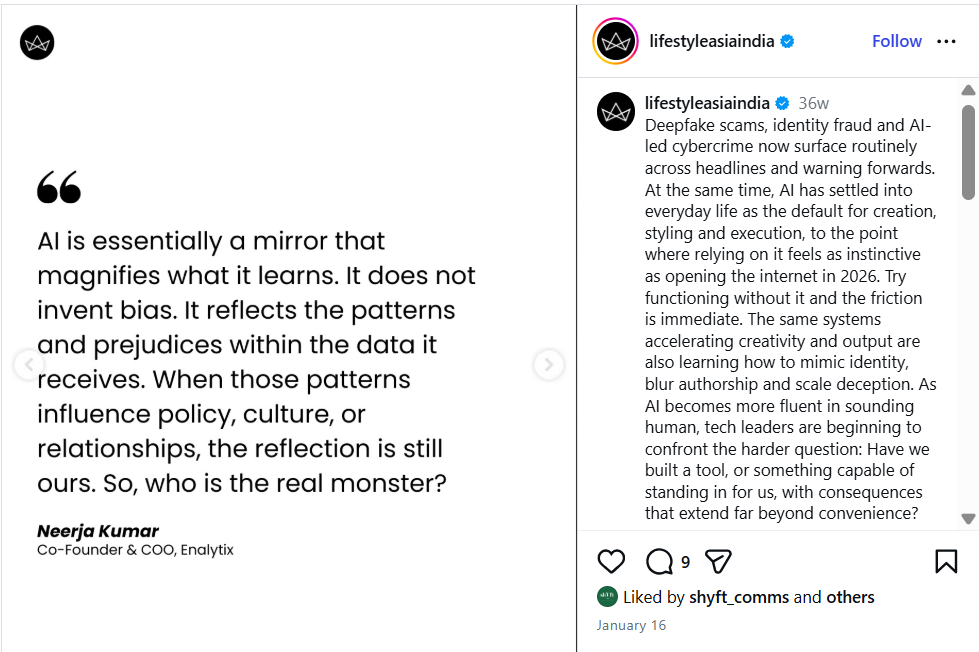
Are we creating monster in the name of AI
Deepfake scams, identity fraud and AI-led cybercrime now surface routinely across headlines and warning forwards. At the same time, AI has settled into everyday life as the default for creation, styling and execution, to the point where relying on it feels as instinctive as opening the internet in 2026.
external_url=https://www.instagram.com/p/DTj9xnGDI09/?utm_source=ig_web_copy_link&stkn=NTc4MTIwNjQ2YQ== -

Neerja Kumar of Enalytix on AI-Powered Video Analytics, Real-Time Operational Intelligence, and Building Privacy-First Automation Solutions
StartupTalky presents Recap’25, a series of exclusive interviews where we connect with founders and industry leaders to reflect on their journey in 2025 and discuss their vision for the future.
external_url=https://startuptalky.com/neerja-kumar-enalytix-saas-industry-recap25/
-

Meet the Startup That Gives Voice to Every Security Camera in India
CCTV cameras are everywhere, from bustling retail stores and cafés to offices and warehouses, yet most remain underutilized, functioning only as passive security devices. Enalytix is changing that reality by turning ordinary cameras into intelligent, real-time business tools powered by AI.
external_url=https://thefortuneindia.com/meet-the-startup-that-gives-voice-to-every-security-camera-in-india/ -

Founders and Mental Load, Why Modern CEOs Need AI Tools as Decision Partners and Not Just Dashboards
Founders carry an invisible mental load. Product, team, strategy, customer, culture, every day decisions get made but are not written down.
external_url=https://startuptalky.com/why-ceos-need-ai-tools/
-

The Growing Demand for Real-Time Monitoring in Critical Infrastructure, Retail, and Public Safety
In today’s world, real-time monitoring for the efficient upkeep of safety and security has become indispensable.
external_url=https://www.unite.ai/the-growing-demand-for-real-time-monitoring-in-critical-infrastructure-retail-and-public-safety/
-
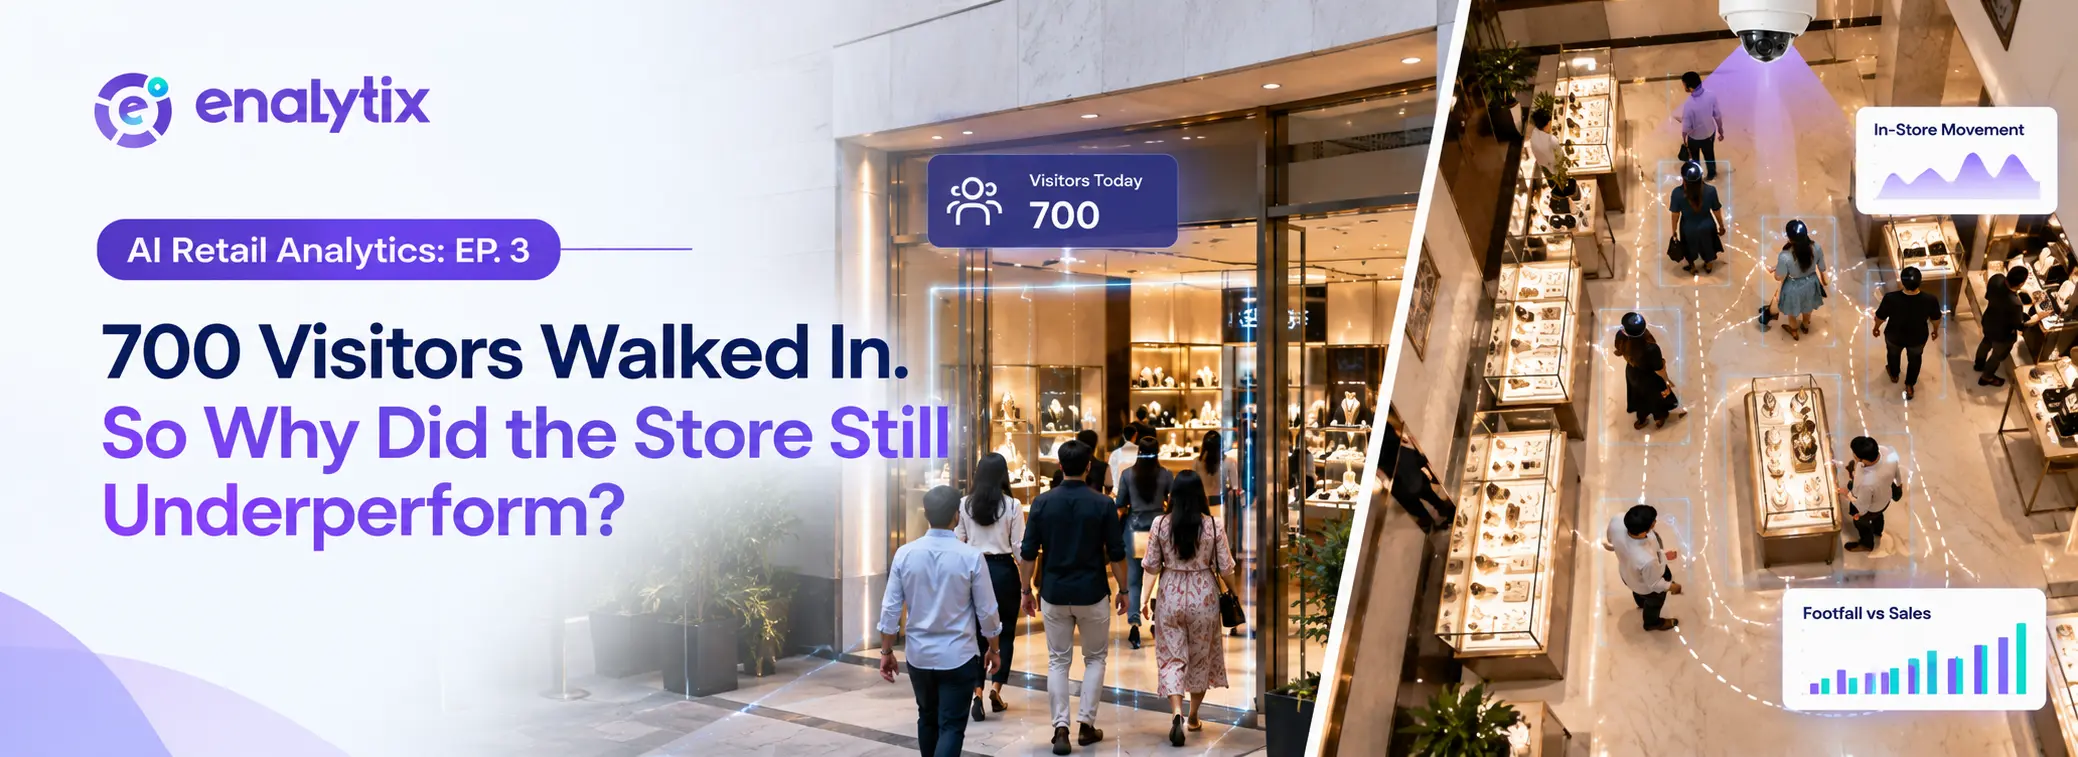
AI Retail Analytics: EP. 3 – 700 Visitors Walked In. So Why Did the Store Still Underperform?
Introduction
In Episode 1, we looked at how a footfall counter finally gave retailers a real number for how many people walked into their store, instead of relying on a feeling. In Episode 2, that same number got broken down hour by hour, revealing exactly when a store’s rush actually starts.
But numbers alone don’t always tell the full story. This episode looks at a trickier question: what happens when footfall is high, but the store’s performance still doesn’t match up? The answer isn’t that the counting was wrong. It’s that a single footfall number was never meant to explain everything on its own.
The Day the Numbers Didn’t Add Up
One day, the store’s people counter records its highest footfall yet. Everyone expects this to translate into a great day, more visitors should mean more business, right?
But sales don’t move the way that number suggests they should. The owner is left staring at two numbers that don’t seem to agree with each other, more people than ever walked in, yet the day still felt underwhelming.
Why More Visitors Doesn’t Always Mean More Business
A high footfall number only confirms one thing: people reached the store. It doesn’t explain why they came, what they were actually looking for, or whether they found it once they got there.
A person counting system can tell you exactly how many people walked through the door. It can’t tell you what happened in their heads once they were inside. On its own, that raw number is only ever half the picture.
The Trap of Comparing One Big Number to Another
The natural instinct is to place footfall and sales side by side and assume they should move together. If footfall goes up, sales should too, and if they don’t, something must be broken.
In reality, two days can show almost identical numbers on a footfall counting machine and still end up with completely different results. One day’s footfall might come from serious shoppers, another’s from people simply passing through during a nearby event. Without knowing which is which, one number can’t really explain the other.
What Footfall Alone Can’t Tell You
This is the limit of counting on its own. A footfall camera or a people counting camera tracks entries reliably, that part isn’t in question. What it can’t tell you is the reason behind a spike.
Was it a promotion? A weekend crowd? A one-off event nearby that had nothing to do with the store itself? None of that shows up in a single day’s number, which is exactly why looking at footfall in isolation can end up more misleading than helpful.
Turning One Number Into a Real Comparison
This is where footfall analytics earns its value. Instead of judging a single day on its own, footfall counter software makes it possible to compare periods against each other, this week against last week, this month against the one before it.
Once that comparison exists, a single spike stops being a mystery and starts being something measurable against an actual trend. A high number that matches previous patterns tells a very different story than a high number that stands out as an anomaly.
Comparing Footfall Across Different Locations
For a chain running more than one store, the same comparison works across locations too. A people counting sensor installed at each site allows footfall from one store to be measured directly against another.
Some locations will consistently pull in more traffic than others, and that pattern becomes visible almost immediately. More importantly, it starts separating the stores where footfall itself is the real issue from the stores where something else, unrelated to traffic, is holding performance back.
What High or Low Traffic Actually Tells You Once You Know the Pattern
A single high-footfall day means something very different from footfall that stays consistently high, week after week. One is a moment. The other is a pattern worth paying attention to.
Once that pattern is visible, a number from a footfall counter app stops being just a count. It becomes a genuine signal, one that shows whether a store’s traffic is a real strength to build on or simply a one-time spike that happened to line up with a good day.
Conclusion
Footfall on its own was never the full answer, and this episode’s underperforming day makes that clear. The real insight comes from comparison: one period against another, one location against another, a pattern instead of a single data point. Enalytix’s Footfall Analytics makes this comparison possible using the same footfall counter or people counting camera a store already relies on, turning a simple entry count into a number retailers can actually act on, not just report.
-
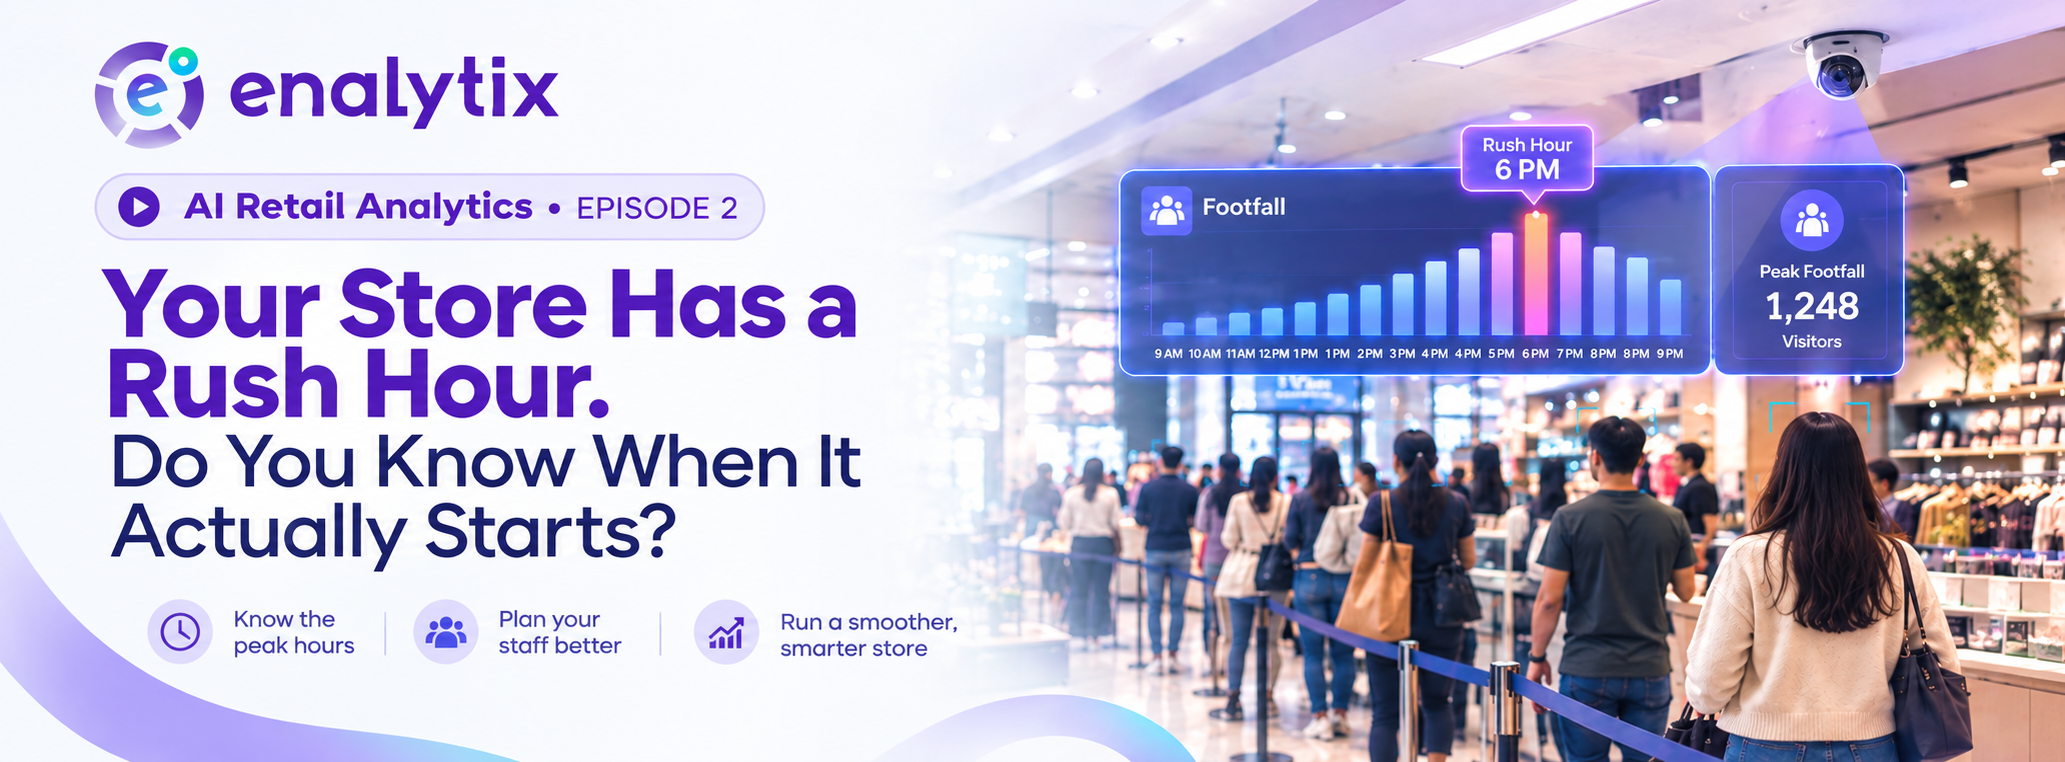
AI Retail Analytics: EP. 2 – Your Store Has a Rush Hour. Do You Know When It Actually Starts?
Introduction
In Episode 1, we looked at how most retailers judge their day by feeling busy or quiet, without ever actually knowing how many people walked in, and how Footfall Analytics finally turns that guesswork into a real number.
But knowing the total footfall for the day is only the first step. The same store can feel completely different depending on the hour, calm in the morning, chaotic by evening, and most owners only notice the rush once it’s already underway. This episode looks at what happens when that daily footfall number gets broken down hour by hour, and why knowing exactly when the rush hits changes how a store actually runs.
Why Every Store Has Hours That Feel Like a Different Business Entirely
Mornings can feel slow and manageable. Staff have time to restock, chat with customers, and keep things tidy. By evening, the same store can turn hectic almost without warning, the same staff, the same layout, but a completely different pace.
Most owners notice this shift only once it’s already in full swing. The rush announces itself by simply happening, not by giving anyone advance notice.
How Staff End Up Reacting to a Rush Instead of Preparing for It
When that shift happens, staff are often still catching up from a quieter hour before. Extra customers start walking in, billing lines grow, questions pile up, and everyone on the floor suddenly feels stretched thin.
By the time the team actually adjusts, whether that’s calling in extra help or reorganising who’s doing what, the busiest part of the rush may already be over. The store spends its peak hour playing catch-up instead of being ready for it.
Why “We Know Evenings Are Busy” Isn’t the Same as Actually Knowing
Most owners will say they already know their evenings get busy. But knowing evenings are busy in a general sense isn’t the same as knowing exactly when it starts, how long it lasts, or how intense it actually gets.
Two different evenings can feel almost identical in memory while being very different in actual footfall. One might have a short, sharp rush at 7 PM. Another might build slowly and stay busy right through closing. Without real numbers, both just get filed away as “a busy evening.”
What Daily Footfall Numbers Start Revealing Once You Look Closely
This is where the same footfall data introduced in Episode 1 becomes useful in a new way. Instead of just one total for the whole day, that data can be broken down hour by hour.
Once it is, patterns start to appear. Certain hours consistently pull in more visitors than others, not just occasionally, but day after day. What felt like a random, unpredictable rush starts looking like something far more familiar: a pattern that repeats, almost like clockwork.
Spotting the Pattern Behind the Rush
Footfall Analytics shows exactly which hours bring in the most visitors, and it does this consistently, not as a one-off snapshot. The same tool that counted total footfall in Episode 1 is now breaking that number down across every hour of the day.
Instead of a vague sense that “evenings are busy,” a store gets a clear, specific picture: when the rush starts, how long it holds, and by how much footfall actually rises compared to the rest of the day.
What Changes Once Peak Hours Are Actually Known
Once that picture exists, staff schedules stop being a rough guess and start being planned around the hours that genuinely need more hands on the floor. Quieter hours no longer carry the same staffing as the busiest ones, freeing up people to actually be useful instead of standing around during a slow patch.
More than anything, the store stops reacting to the rush and starts preparing for it before it even begins.
Why This Isn’t Just About One Busy Hour
These patterns rarely stop at a single hour. Peak-hour trends often repeat across certain days of the week too, not just certain times of day. A Friday evening rush might look completely different from a Tuesday evening, and once that becomes visible, slow periods stop being wasted time and start becoming opportunities of their own, for restocking, training, or simply running leaner.
What emerges isn’t just a busier hour identified. It’s a real rhythm to the store’s entire week, replacing the sense that every day is unpredictable with an actual, repeating shape.
Conclusion
Knowing how many people walked in was Episode 1’s answer. Knowing exactly when they walk in is this episode’s. Together, they turn a store’s daily footfall from a single number into a detailed map of how the day actually unfolds.
Enalytix’s Footfall Analytics makes that shift possible using the same setup already counting visitors, giving retailers not just a headcount, but a clear sense of when their store truly comes alive, and when it doesn’t.
-
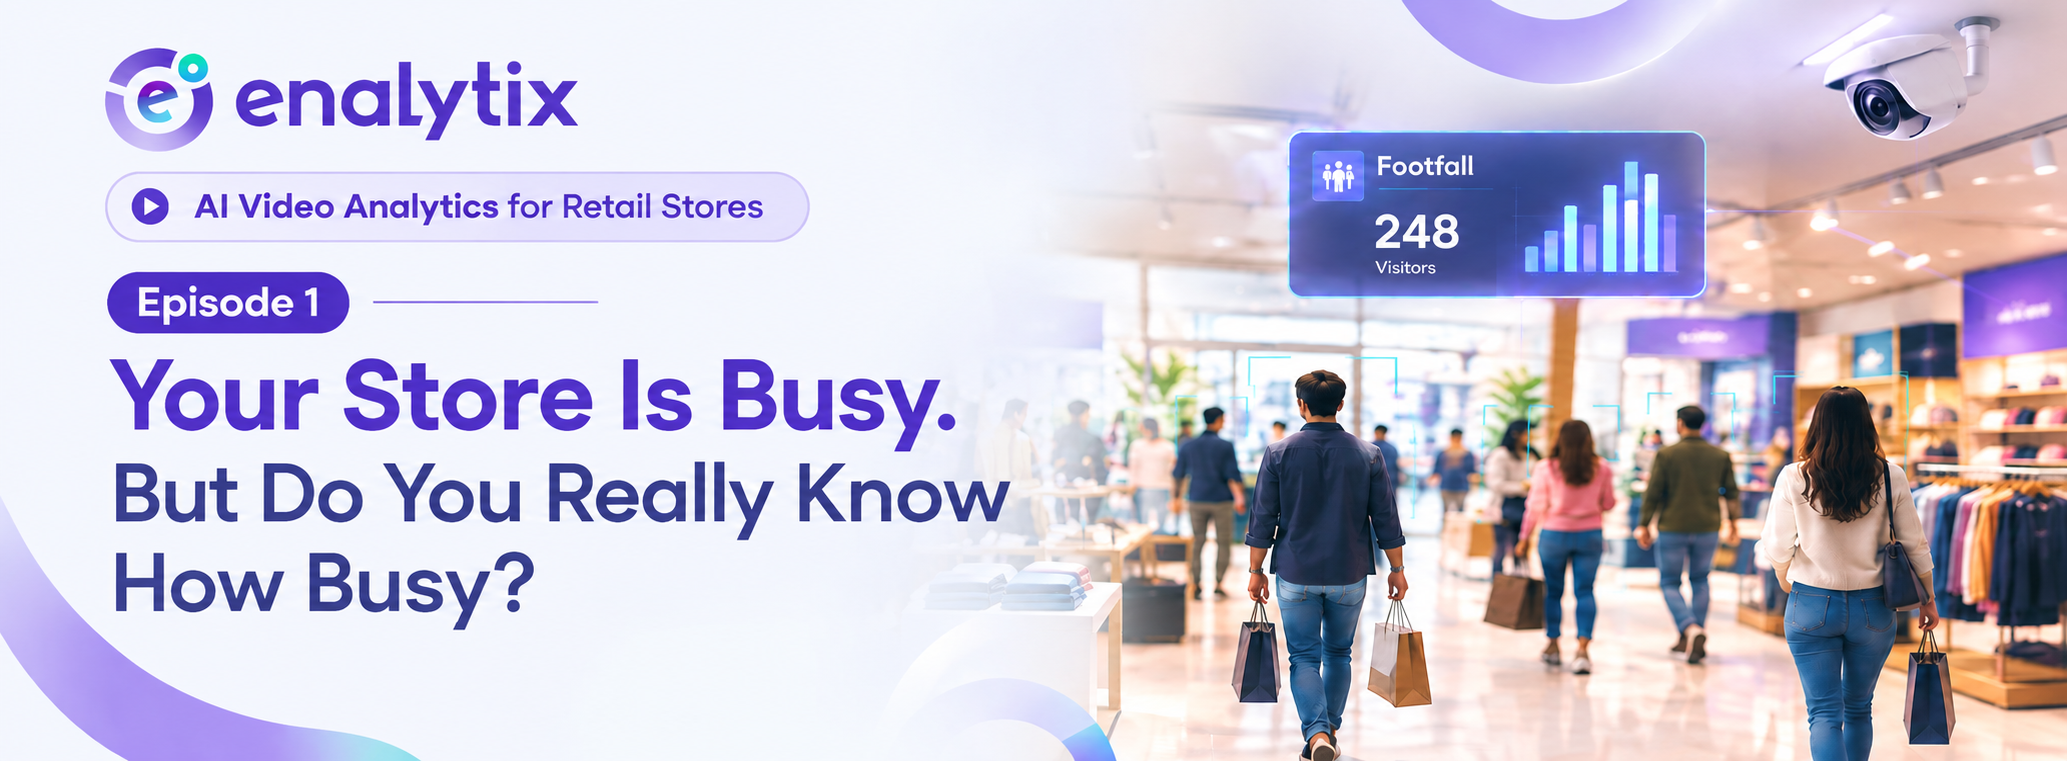
AI Retail Analytics: EP. 1 – Your Store Is Busy. But Do You Really Know How Busy?
Introduction
Ask any store owner how their day went, and they’ll usually have an answer ready. Busy. Slow. Better than yesterday. But ask them how many customers actually walked in, and most of the time, that answer doesn’t exist. It’s a feeling, not a number.
This is the first gap most retailers don’t even realise they have. They’ve got cameras covering every corner of the store, yet nobody can say exactly how many people came in today, what time the store was busiest, or how that compares to last week. This blog looks at why that gap exists, why gut feeling can’t be trusted to fill it, and how the same cameras already installed in the store can finally start giving retailers a real answer.
What a “Good Day” at the Store Usually Looks Like
By afternoon, the store feels crowded. There’s a small line at the billing counter, staff are moving quickly between customers, and everything just feels busy. The owner clocks this and files it away as a good day.
By evening, that’s really all there is to go on. A general sense of how the day felt, built out of a few busy moments and a bit of end-of-day tiredness. Nothing written down, nothing measured, just an impression that gets treated like a fact.
Why Gut Feeling About Footfall Can’t Be Trusted
The problem is that one genuinely busy hour can make an entire day feel successful, even if the other nine hours were quiet. A short rush right before lunch can colour how the owner remembers the whole day, long after the store has gone back to being empty.
The same owner, on two very different days, might call both of them “good” simply based on mood or energy rather than what actually happened. Without an actual number to check against, every judgement about how the store performed is really just a guess dressed up as an observation.
Why Your Cameras Were Never Actually Counting Anyone
Here’s the part most retailers miss. The CCTV covering the store was never installed to answer this kind of question in the first place. It was put up to record incidents, catch problems if something went wrong, and give the owner a general eye on the floor.
Nobody ever expected that camera to tell them how many people walked in on a Tuesday afternoon. So even with cameras pointed at every entrance and aisle, the most basic number a retailer could ask for, total visitors, was never actually being captured. The store has been watched this whole time. It just was never being counted.
The Footage Sitting Unused Behind Every Camera
Every single day, from opening to closing, hours of footage pile up on a hard drive somewhere. Almost none of it ever gets reviewed, unless something specific happens that someone needs to go back and check.
That means a massive amount of information about the store’s daily traffic already exists, sitting completely unused. The data was always there. Nobody had a reason, or a way, to actually pull anything useful out of it.
Why Counting Customers by Hand Was Never a Real Option
The obvious fix sounds simple enough on paper: put someone at the door with a clicker and count people as they walk in. In practice, no store can realistically do this every day, all day, for every shift.
Staff already have their hands full serving customers, managing stock, and keeping the floor running. Even if someone did try to count manually for a while, the number would still end up rough and inconsistent, easy to lose track of the moment the store gets even a little busy. This was never going to be a real solution, just a workaround that would fall apart the first time it mattered.
How Footfall Analytics Turns an Existing Camera Into an Automatic Counter
This is where Footfall Analytics changes the picture. It works with the same cameras a store has already installed, no new hardware, no extra staff standing at the door. Every person walking in gets counted automatically, in real time, without anyone having to watch a screen or track anything by hand.
The cameras that were only ever recording for security suddenly start doing something they never did before: turning everyday store traffic into an actual, measurable number.
What the Store Learns Once Every Visitor Is Actually Counted
Once footfall is being tracked properly, a retailer finally has a clear, reliable number for exactly how many people visited on any given day. Comparing one day to another stops being a matter of memory and starts being a matter of fact, this Tuesday against last Tuesday, this week against last week.
More than anything, it gives the store its first real data point, one that every future decision about staffing, timing, or store performance can actually be built on, instead of a guess.
Conclusion
A store can look busy without anyone actually knowing how busy it was, and for most retailers, that’s exactly how every day has been judged. Footfall Analytics doesn’t ask a retailer to change anything about their store. It simply gives the cameras already watching the floor a new job: counting.
Enalytix’s Footfall Analytics turns that basic, overlooked number into the starting point for understanding a store the way it actually runs, not the way it feels at the end of a long shift.