Blog

  • Occupancy Tracking Without Manual Headcounts: What Real-Time Data Is Teaching Facility Managers About Space Usage

    Occupancy Tracking Without Manual Headcounts: What Real-Time Data Is Teaching Facility Managers About Space Usage

    Introduction

    Walk into any office or co-working space, and someone there can probably tell you how many desks the building has. Almost nobody can tell you how many of those desks are actually being used right now. That gap between what a facility owns and what it actually uses is bigger than most people realise, and it’s the same gap that’s costing facility managers real money every single day.

    This is the story of how that gap gets closed, not by adding more staff to walk around and count, but by finally giving the building a way to count itself.

    Why Facility Managers Still Rely on Guesswork to Track Space Usage

    Most facility teams still track space usage the old way: a walkthrough here, a booking system there, maybe a rough estimate based on how full the parking lot looks. None of this gives an accurate number. A meeting room booked for two hours might sit empty after the first twenty minutes. A floor that looks packed at 10 AM might be half empty by 2 PM.

    Without a real occupancy monitoring system, facility managers are left working off guesses dressed up as data, and that’s exactly the kind of guess that starts costing money once it’s repeated across an entire building.

    The Cost of Not Knowing How Many People Are Actually in a Room

    That cost shows up in places most people don’t think to look. Lights stay on in empty conference rooms. Air conditioning runs at full strength on a floor that’s nearly empty. Extra floors get leased because a report says the building is “at capacity,” when the real number of people using the space on any given day is far lower.

    None of this looks like a single big loss. It looks like small, steady waste that adds up month after month, and it stays invisible for exactly as long as nobody’s counting.

    How Real-Time Occupancy Tracking Replaces Manual Headcounts

    This is where a people counting system changes the picture. Cameras already installed for security can be used to track occupancy in real time, room by room, floor by floor, without anyone walking around with a clipboard. Instead of a rough guess made once a day, facility managers get a live number that updates as people come and go.

    Camera analytics turns that number into something usable: which rooms are empty right now, which floors are actually busy, and which spaces are being paid for but barely used. And once that live number exists, it’s only a matter of time before it gets used to fix a real, ongoing problem.

    How a Co-Working Facility Cut Wasted Space by Tracking Real Occupancy

    Take a co-working facility running multiple floors, each one assumed to be near full based on membership numbers alone. Once occupancy monitoring went live, the real picture looked nothing like the membership sheet.

    One floor, marked as fully booked, was averaging less than half its seats occupied on any given day. Members had signed up but weren’t showing up nearly as often as expected. Meanwhile, a smaller floor that looked underused on paper was consistently packed during peak hours. The facility had been planning space, staffing, and even future leasing decisions around numbers that didn’t reflect what was actually happening inside the building.

    Once that mismatch was visible, the fix wasn’t complicated. It just needed real data to point at the right floor.

    Turning Occupancy Insights Into Smarter Space and Staffing Decisions

    With real occupancy data in hand, the facility stopped guessing and started acting on it. The underused floor was reassigned to a smaller team, freeing up space that had been sitting empty for months. Cleaning staff and reception hours were shifted to match when floors were actually busy, instead of running the same schedule everywhere all day.

    Power usage monitoring added one more layer, matching lighting and air conditioning to real occupancy instead of a fixed timer. What started as a way to just count people quickly turned into a way to run the entire facility more efficiently.

    What Continuous Occupancy Data Means for the Future of Facility Management

    That shift is the bigger story here. Once a facility has continuous occupancy data, decisions that used to rely on assumptions, leasing, staffing, energy use, start relying on what’s actually happening inside the building.

    Enalytix’s occupancy monitoring turns cameras a facility already has into a live, ai-powered video analytics tool that tracks space usage the way it should have been tracked all along. For any facility manager tired of planning around guesswork, that’s the real shift: not just knowing how many people are in a room, but finally knowing what to do about it.

  • Pilferage Monitoring at the Counter: How One Café Chain Traced Its Unexplained Daily Losses

    Pilferage Monitoring at the Counter: How One Café Chain Traced Its Unexplained Daily Losses

    Introduction

    Running a café chain means keeping track of a lot of things at once footfall, staff, stock, and of course, the daily sales. Most days, everything adds up. But every once in a while, the numbers don’t quite match, and it’s easy to brush it off as a small mistake.

    The real problem starts when this “small mistake” keeps happening, again and again, across different outlets, with no clear reason. At that point, it’s not just a rounding error anymore. It’s a question worth answering.

    This is the story of how one café chain finally got an answer not by hiring more staff to keep watch, but by getting smarter about the cameras it already had.

    The Daily Shortfall a Café Chain Couldn’t Explain

    Every night, a café manager counts the till before closing. Some nights, the number is a little short. Not a big amount just enough to notice. One night, it’s easy to ignore. Every week, it isn’t.

    Now think of this happening across ten or fifteen outlets, not just one. Suddenly it doesn’t look like a mistake here and there. It looks like something is happening on a regular basis, and no one has actually caught it yet.

    And here’s the strange part every outlet already has cameras watching the counter. So why wasn’t anyone catching it?

    Why Standard CCTV Wasn’t Enough to Catch Counter-Level Losses

    Most cafés already have cameras at the counter. So the problem was never “we don’t have cameras.” The real problem is what those cameras were actually doing.

    A normal CCTV camera just records. It doesn’t tell anyone when something looks wrong. The footage sits there, and unless someone decides to go back and check it, nothing happens. By the time anyone thinks to look, the loss already happened days or weeks ago.

    The cameras just needed to start doing more than recording.

    How AI-Powered Pilferage Monitoring Flagged the Pattern Manual Audits Missed

    A manual audit can tell you money is missing. It usually can’t tell you exactly when it went missing, or during which shift.

    Pilferage monitoring solves this by watching the counter all the time and picking up on the exact moment something doesn’t look right, a sale that isn’t billed properly, an item handed over without being logged, something unusual happening during a shift change. As soon as it happens, it gets flagged. Not weeks later. Right away.

    Here’s what that looked like for one café chain once it went live across every outlet.

    What the Pattern Looked Like Once Monitoring Went Live

    Picture a café chain with a dozen outlets, each one losing a little money here and there. Once pilferage monitoring was switched on, the pattern that had stayed hidden for months became clear within a few weeks.

    The losses weren’t spread out evenly. They kept happening around the same shifts, and at a couple of specific outlets more than others, something a monthly audit could never have pointed to on its own.

    Once the pattern was clear, the way the team worked around it changed too.

    What Changed Once the Café Chain Could See Losses in Real Time

    Before this, managers only found out about losses after the fact, once a report showed a dip in numbers. Now, they get an alert the same day, with actual footage to back it up instead of a guess.

    This isn’t about suspecting every staff member. It’s about having clear proof of exactly what happened, when it happened. No more guessing games.

    And once the counter was covered, it turned out the same cameras could do a lot more than just that.

    Turning Pilferage Data Into a Stronger Counter Operation

    The same cameras that catch losses at the counter can do a lot more than that. They can flag hygiene issues during food prep, serve as proof when something needs to be investigated, or catch someone entering the outlet after hours when it should be empty.

    What started as one café chain trying to figure out where its money was going ends up as something bigger, a counter that’s finally being watched the way it always should have been.

    Conclusion

    What started as one café chain trying to figure out where its money was going ended up teaching it something bigger. The daily shortfall wasn’t bad luck or a staffing problem, it was a visibility problem. Cameras were recording everything but understanding nothing.

    Once pilferage monitoring took over, losses that had hidden across a dozen outlets for months became traceable within weeks, and a counter that once ran on guesswork is finally being watched the way it always should have been.

  • Crowd Management During Sawan: How AI-Powered CCTV Keeps Temple Towns Safe

    Crowd Management During Sawan: How AI-Powered CCTV Keeps Temple Towns Safe

    Introduction

    It’s 4 AM in a temple town somewhere in North India. The gates haven’t opened yet, but the queue outside already stretches past the last streetlight. By noon, this town’s population will have quietly tripled. By evening, the parking lots will be full, the lanes leading to the sanctum will be shoulder to shoulder, and somewhere in the crowd, an elderly kanwariya will be looking for a bench that doesn’t exist.

    This is Sawan. And every year, the story repeats itself, not because temple administrations don’t care, but because they’re trying to manage a modern crowd problem with a pre-modern toolkit: a few dozen guards, some barricades, and hope.

    We think the toolkit needs an upgrade. Here’s what that actually looks like, hour by hour.

    5 AM — The Gates Open, and So Do the Blind Spots

    The first rush is always the hardest to predict. Nobody knows exactly how many people are inside the complex at any given moment, not the administration, not the police, not the volunteers coordinating water and medical camps.

    This is where footfall counting changes the entire equation. Cameras that are already installed for security, the same CCTV infrastructure sitting on poles and gates can be turned into real-time people-counters. Instead of guessing whether the complex is at 60% or 160% capacity, administrators get a live number. Not an estimate from last year’s Sawan. A number, right now, updating as people walk in and out.

    That single number is the difference between “let’s see how it goes” and “we need to slow entry at Gate 3 before it becomes a problem.”

    9 AM — The Moment Before It Becomes a Headline

    Every stampede story in the news starts the same way: a bottleneck nobody saw building until it was too late. A narrow lane, a sudden surge, a few thousand extra people who arrived in the last twenty minutes.

    Stampede prevention– isn’t really about reacting faster once a crowd crush starts, by then it’s already a crisis. It’s about catching the density curve early. When camera-based analytics flag that a specific lane or gate is approaching unsafe crowd density, not “crowded,” but a measurable, rising number teams can act while there’s still room to act: reroute a queue, open a second lane, pause entry for ten minutes.

    It’s the same technology as the footfall counter, just pointed at a different question. Not “how many people are here” but “how many people are here, in this ten-meter stretch, right now.” That’s the number that actually prevents tragedies.

    11 AM — Who’s Actually on Duty?

    Behind every well-managed Sawan crowd is an even bigger, less visible crowd: volunteers, medical staff, security personnel, and municipal workers, all rotating through long shifts across a sprawling temple complex.

    Manual attendance registers don’t scale to this. A volunteer who signed in at 6 AM at the east gate might genuinely be needed at the west gate by 11, but if nobody can confirm who’s actually present and where, planning tomorrow’s shift is guesswork.

    Facial recognition attendance solves this quietly, in the background. People are marked present the moment they pass a camera, no queues, no registers, no double-checking. For an event coordinator managing hundreds of temporary staff across a multi-day mela, that’s not a minor convenience. It’s the difference between knowing your actual on-ground strength at any hour and finding out you were short-staffed only after something went wrong.

    1 PM — The Traffic Jam Nobody Warned You About

    Ask any local shopkeeper what actually breaks down first during Sawan, and most won’t say the temple gates. They’ll say the parking.

    Buses, private cars, two-wheelers, all converging on a town that has maybe a tenth of the parking it needs, on roads that weren’t built for this. When lots fill up unannounced, vehicles start parking wherever they can, and what should be a footpath becomes a bottleneck too.

    Parking utilisation monitoring turns this from a mystery into a managed system. Cameras track occupancy across designated lots in real time, so authorities know exactly which lots are full and which still have room and can direct incoming traffic accordingly, before it piles up at the entrance. Pilgrims spend less time circling for a spot. Local roads stay clearer. And the town’s traffic police get a live map instead of a walkie-talkie full of guesses.

    3 PM — The Person Everyone Forgets to Design For

    Here’s what usually happens when something goes wrong for a pilgrim mid-crowd: a toilet block runs out of water, a lane goes dark after sunset, someone’s bag goes missing, a loudspeaker outside a rest area won’t stop blaring at 2 AM. In a normal year, none of this gets reported. There’s no one to tell, and even if there were, nobody has time to stand in another queue just to file a complaint.

    This is the gap Enalytix’s Citizen Feedback App is designed to close. It’s a simple, category-based reporting screen: Toilet/Sanitation Issues, Transport/Traffic, Overcrowding/Safety, Cleanliness/Waste, Lost Items/Theft, Drinking Water Problem, Lighting/Electricity, Loud Noise/Disturbance, and a catch-all Other Complaint.

    Any pilgrim taps the category that matches their problem and it goes straight to the team that can actually act on it, no standing in line, no chasing down a volunteer, no complaint lost in the noise of the crowd. It’s built for every pilgrim in the crowd, but it matters most for the ones least equipped to chase down help on their own elderly visitors especially, who are the least likely to track down a volunteer when a toilet is unusable or a lane is unsafe after dark, and least likely to have the patience to file a complaint through five layers of bureaucracy.

    A tap-and-report system means their problem reaches someone the moment it happens, not after a family member notices, not after it becomes a bigger issue.

    For the administration, it’s the same principle as everything else in this system: turning something invisible into something they can see and act on.

    Overcrowding and safety complaints flow into the same operational picture as the density data from the gates. Lost item reports can be cross-checked against the same cameras tracking footfall. Nothing about the crowd stays unreported just because no one had the time to walk over and say something.

    By Nightfall, It’s Not Guesswork Anymore

    None of this requires temple towns to rebuild their infrastructure from scratch. The cameras are usually already there, watching gates and lanes for security. What changes is what those cameras are asked to do count instead of just record, flag density instead of just capture footage, recognize a face for attendance instead of only for surveillance.

    That’s the real story of crowd management during Sawan: not new hardware, but smarter use of what’s already watching. Footfall counting tells you how many. Stampede prevention tells you where it’s getting dangerous. Facial attendance tells you who’s on the ground. Parking monitoring tells you where the vehicles are. And the Senior Citizen App makes sure no one gets lost in a system built for millions.

    Put together, it’s not a surveillance story. It’s a safety story, one where a temple town that welcomes lakhs of pilgrims a day can do it without leaving anyone, from the frontline volunteer to the elderly kanwariya, to chance.

    Enalytix turns existing CCTV infrastructure into intelligent, insight-driven systems helping organizations manage crowds, safety, and operations without ripping out what’s already working.

  • How Number Plate Recognition Is Powering Smarter Parking Across India

    How Number Plate Recognition Is Powering Smarter Parking Across India

    Introduction


    Let’s be completely realistic about managing a major corporate tech park or a commercial shopping mall parking lot in India during peak morning rush hours. You have a massive queue of vehicles spilling onto the main road, security staff scrambling to check physical decals, and manual logging slowing down entry to a crawl. In the middle of this gridlock, unauthorized vehicles easily slip right through because a manual monitor got distracted by a tailgating car or a heated argument at the barrier gate.

    This is the classic illusion of perimeter control. Just because you have physical guards and boom barriers doesn’t mean your entry management is truly secure or efficient. Traditional manual tracking creates an immediate bottleneck where facility operations are forced to compromise: you either sacrifice speed for rigorous checks or sacrifice security to clear the traffic spillback.

    Moving away from legacy security theater demands a data-driven approach. Integrating targeted ai in security networks directly at your ingress and egress lines changes the entire framework. It transitions a parking asset from a passive space into an automated gate management ecosystem that processes vehicular access efficiently long before a car reaches a complete dead stop.

    What Automatic Number Plate Recognition Actually Does

    Don’t mistake basic digital photography or standard video recording for true automated enforcement. A conventional surveillance setup merely captures video frames of a passing vehicle, leaving it up to a human eye to log the letters or search through hours of dead footage during an audit.

    An advanced Automatic Number Plate Recognition (ANPR) architecture works entirely behind the scenes to create a real-time tracking loop:

    • It identifies an approaching vehicle footprint as it hits the scanning boundary.
    • It extracts the alphanumeric text directly from the license plate using specialized optical character recognition (OCR) engines.
    • It translates that visual frame data into a light, encrypted alphanumeric text string within milliseconds.
    • It cross-references that string against your centralized employee or vendor database to instantly authorize or block access.

    This continuous digital process allows entry checkpoints to operate seamlessly without requiring an employee to roll down their window in monsoon rain or fumble around looking for a physical access card.

    Use Cases Beyond Highway Tolling

    While fast-tag networks have made plate reading a standard feature on national highways, the application of this technology has quietly shifted inward toward urban business infrastructure. Modern logistics facilities, enterprise zones, and multi-tenant commercial real estate use plate logging to streamline daily operations.

    For instance, high-volume retail hubs use ANPR systems to automate parking validation structures, track customer peak visit hours, and identify VIP or recurring shoppers the moment they cross the outer gate lines. Similarly, multi-national logistics and distribution yards layer this technology over their warehouse management workflows. By tracking arrival times automatically, supply chain managers can monitor exact vehicle turnaround times and identify loading bay delays without forcing delivery drivers to manage slow paper manifests at the gate.

    ANPR for Campus and Corporate Park Access Control

    The biggest operational hurdle for enterprise campuses is handling massive transit surges within limited, specific hour windows. Relying on physical identity cards or RFID tags requires significant capital expenditure on individual distribution, tracking lost passes, and managing physical hardware wear and tear.

    Transitioning to advanced ai video surveillance loops completely removes physical tokens from corporate entry management. As a registered car approaches the gate, the camera captures the plate data from up to ten meters away and communicates directly with the gate mechanics.

    By eliminating the manual “card-tapping” pause, you maximize entry velocity and prevent the entry lanes from clogging local roads. Furthermore, this provides enterprise teams with a reliable, unalterable digital footprint of all vehicular assets on the property, creating a clean audit trail that integrates effortlessly into workplace attendance or guest management software.

    Accuracy Challenges with Indian Plates and Lighting

    Deploying a global tracking algorithm directly into the Indian landscape presents unique localized hurdles. Indian roads are a chaotic mix of varying license plate styles—ranging from standard high-security registration plates (HSRP) to regional fonts, customized letter sizes, and non-reflective retro plates covered in dust.

    Relying on an unoptimized, off-the-shelf system will quickly lead to massive false rejection rates, especially during lighting shifts. Standard camera lenses get entirely blinded by oncoming high-beam headlights at night or suffer from serious motion blur when a vehicle moves too quickly past the check line.

    To overcome these technical limits, an enterprise-grade setup requires an explicit combination of specialized deep-learning text models and robust hardware. The software must be specifically trained to identify localized irregularities, dirt accumulation, and non-standard layouts, translating visual anomalies into clean, actionable text logs flawlessly.

    Choosing the Right ANPR Camera and Software Combination

    Achieving a high-accuracy, zero-friction tracking environment is not just about choosing a dedicated Automatic Number Plate Recognition Camera to capture the image; the true operational value lies entirely in the cognitive software layer driving it. While high-resolution edge hardware acts as the eyes, our core automatic number plate recognition software acts as the brain, transforming raw, chaotic video inputs into highly structured corporate data.

    The software engine is custom-built to address specific commercial operational demands through three key core capabilities:

    • Advanced OCR and AI-Parsing for Indian Conditions: Standard algorithms fail when encountering dirt, custom text sizes, or localized regional script variations. Our enterprise software utilizes specialized deep-learning text models that dynamically clean visual occlusion, compensate for severe headlight glare at night, and accurately read cracked or non-reflective plates with a sub-second processing speed.
    • Dynamic Whitelisting and Multi-Category Rule Management: The architecture doesn’t just read numbers; it maps access intent. Facility managers can configure distinct vehicle profiles—such as blacklisted vehicles, corporate VIPs, long-term employee passes, and daily vendor logistics. The second a plate is parsed, the software instantly triggers localized actions, whether opening a boom barrier for an executive or sending an immediate security desk alert for a restricted vehicle.
    • Seamless API Integration and Data Sync: The software completely avoids closed data silos. It features robust, open API frameworks that hook directly into your pre-existing building infrastructure—including parking management systems, payroll setups, visitor registration databases, and tenant billing tools.

    With Enalytix, you move away from isolated, rigid camera setups toward a flexible, intelligent campus perimeter. We repurpose and optimize your physical security network into a unified vehicle management tool that drives efficiency, safeguards human capital, and keeps your operations moving at the speed of data.

  • Securing Border Checkposts with AI-Powered Video Intelligence

    Securing Border Checkposts with AI-Powered Video Intelligence

    Introduction

    Border checkposts operate under a kind of pressure most security setups never have to deal with. There’s no fixed crowd to monitor, no single entry point to watch, just long, often unlit stretches of terrain on one side, and a steady, unpredictable flow of vehicles on the other. Every checkpost carries the weight of being the last line of verification before something or someone moves from one side of a boundary to the other.

    For years, the answer to this has been more cameras, more patrols, more manpower. And to an extent, that’s worked. But the pattern that keeps repeating across checkposts is a familiar one: the technology records everything, yet somehow still misses the moment that mattered. Not because the equipment failed, but because watching hours of footage in real time isn’t something a human being was ever built to do without fail.

    This is the story of what changes when a checkpost stops relying purely on human attention span, and starts pairing it with AI-powered video intelligence systems that don’t get tired, don’t blink, and don’t wait for the next patrol round to notice something worth acting on.

    To understand why that shift matters, it helps to see what a typical night at a checkpost still looks like today.

    Why Traditional Border Checkpost Surveillance Is No Longer Enough

    It’s 2 AM at a remote border checkpost. A lone guard stares at a bank of CCTV monitors, eyes heavy, coffee gone cold hours ago. Somewhere on screen three, a shadow moves along the perimeter fence. He doesn’t catch it, not because he’s careless, but because no human being can watch twelve screens with equal attention for an eight-hour shift, night after night.

    This is the quiet reality behind most border checkpost security today. Cameras record everything, but recording isn’t the same as noticing. Traditional CCTV systems are built to store footage, not to interpret it. They tell you what happened yesterday. They rarely tell you what’s happening right now, in the ninety seconds that actually matter.

    Border checkposts carry a different kind of pressure than a mall or a warehouse. The perimeter is longer, the terrain is harder to light, and the stakes of missing something are higher. A guard’s attention naturally drifts after long stretches of nothing happening and that’s precisely when something does. The gap isn’t a people problem. It’s a tooling problem. And it’s exactly where video intelligence starts to change the equation.

    Detecting Unauthorized Border Crossings with AI-Powered Intrusion Detection

    That gap is where the story usually turns and for border security teams, it turns toward intrusion detection. Instead of asking a person to watch a fence line for hours, an AI-powered intrusion detection system watches it continuously, flagging movement the moment it crosses a defined boundary.

    A Virtual Line and Tripwire capability works exactly on this principle. Security teams draw a virtual boundary along a sensitive stretch a fence gap, a riverbank crossing, an unmanned access road and the system monitors that line around the clock. The moment someone or something crosses it, an alert fires instantly, without waiting for a human to spot it on a monitor.

    Picture a checkpost stationed along a stretch of open terrain where the physical fence has natural blind spots. A patrol team used to rely on periodic foot rounds every few hours, hoping nothing slipped through in between. With a virtual tripwire in place, that same stretch is now watched continuously. When a vehicle or a person crosses the marked boundary outside authorized hours, the system raises the flag in real time not after the fact, not during the next patrol, but the moment it happens. The guard on duty isn’t guessing anymore. They’re responding.

    But the ground is only half the perimeter. Every checkpost also has a gate and where there’s a gate, there’s a steady line of vehicles waiting to be checked.

    How Automatic Number Plate Recognition (ANPR) Strengthens Border Vehicle Screening

    That queue at the gate brings its own challenge. Border checkposts deal with something just as demanding as foot crossings: vehicles. Hundreds of them, some routine, some worth a second look, all needing to be verified quickly without turning the checkpost into a bottleneck.

    This is where Automatic Number Plate Recognition earns its place. An ANPR-enabled camera reads vehicle number plates as they approach, cross-checks them against a maintained list, and flags matches instantly whether that’s a vehicle under watch, one reported for an incident, or one simply outside its permitted route.

    Think of a checkpost that processes a steady stream of commercial and private vehicles through the day. Manually noting down every plate and cross-referencing it against a watch list isn’t just slow it’s the kind of task fatigue quietly undermines. With ANPR in place, that verification happens automatically as each vehicle rolls through. A flagged number plate triggers an immediate alert to the checkpost team, who can then act — stop the vehicle, inspect it, log it while the rest of the traffic moves through without unnecessary delay. Screening gets faster and more consistent, without adding pressure on the personnel doing the watching.

    Now the checkpost has two things working in its favour, the ground is covered, and so is the gate. The real shift happens when those two stop working as separate systems and start working as one.

    Combining Intrusion Detection and ANPR for Real-Time Threat Monitoring

    Individually, intrusion detection and ANPR each close a real gap. Together, they close the space between them. A border checkpost rarely faces one kind of risk in isolation — a perimeter breach on foot and a suspicious vehicle approaching the gate can happen within the same window, and a security team needs visibility into both without splitting focus.

    This is where combining the two capabilities changes how a checkpost operates. Intrusion detection covers the ground fence lines, unmanned stretches, restricted zones. ANPR covers the road every vehicle entering or leaving. Layered together, they give the security team a single, continuous picture instead of two separate ones they have to mentally stitch together.

    Consider a checkpost handling both vehicle traffic and an extended perimeter on the same shift. A virtual tripwire alert on the eastern fence and an ANPR flag on an approaching vehicle might occur minutes apart and previously, catching both in time depended entirely on how much a guard could hold in their head at once. With both systems running together, each event is logged and alerted independently and instantly, giving the response team the full picture without needing to piece it together under pressure. Real-time monitoring stops being a best effort and starts being a reliable baseline.

    But visibility alone doesn’t stop anything. Someone still has to find out and find out fast enough to do something about it.

    AI-Powered Alerts for Faster Response to Suspicious Activities at Border Checkposts

    That’s the part detection alone can’t solve. A system that spots an intrusion or flags a vehicle is only half the job, the other half is making sure the right person is told, immediately. This is where alerting design becomes as important as the detection itself.

    A well-designed alert framework is built to close that last gap. When a virtual tripwire is triggered or an ANPR match occurs, the system pushes an alert directly to the relevant team, not buried in a log file waiting to be reviewed later, but delivered in the moment, so a response can begin while it still matters.

    Picture the checkpost team from earlier, now working with both systems live. A tripwire trigger on the perimeter sends an immediate alert to the nearest patrol unit, who reach the location within minutes rather than discovering the breach on the next scheduled round. At the same time, an ANPR flag on a watch-listed vehicle notifies the gate team before the vehicle even reaches the barrier. Neither event waited on a person noticing a screen. Both moved through a system built to notice first and inform second turning response time from a variable into something the checkpost can actually count on.

    Zoom out from any single alert, and a pattern starts to form across the whole operation.

    Key Benefits of AI Video Intelligence for Border Security Operations

    Follow that checkpost through a full week, and the shift becomes easier to see than to describe in the abstract. A few outcomes stand out consistently:

    • Continuous vigilance without fatigue — the system doesn’t lose focus at hour six of a shift the way a person naturally does.
    • Faster verification at scale — ANPR processes vehicles in real time, keeping traffic moving without compromising screening.
    • Reduced dependence on manual patrols alone — foot patrols still matter, but they’re now backed by continuous automated coverage between rounds.
    • Consistent, real-time alerting — response teams act on live information instead of retrospective footage review.
    • A unified operational view — perimeter and vehicle monitoring work together rather than as disconnected systems.

    None of this replaces the personnel stationed at a checkpost. It changes what their attention is spent on — moving them from constantly watching for something to actively responding to something confirmed.

    And that shift in attention is really the bigger story here one worth looking at beyond a single checkpost.

    Conclusion: The Future of Smart Border Security with AI Video Analytics

    That shift traces back to something border security has always depended on: people paying close attention under difficult conditions, for long hours, often with little support beyond a monitor and a flashlight. AI video intelligence doesn’t ask them to pay less attention it removes the burden of having to notice everything alone.

    As tools like intrusion detection and ANPR become standard rather than exceptional, the checkpost of the future starts to look less like a static watchpoint and more like an active system one that sees continuously, flags precisely, and hands its people the moment they need to act, right when it matters. That’s not a distant vision. It’s already the direction border security operations are moving toward, one checkpost at a time and platforms like Enalytix are helping make that shift practical, one capability at a time.

  • Stampede Prevention at Scale: Lessons from Managing Crowds at Indian Temples and Festivals

    Stampede Prevention at Scale: Lessons from Managing Crowds at Indian Temples and Festivals

    Introduction

    It starts the same way almost every time. A narrow lane. A queue that was orderly an hour ago. A rumour, a delay, a gate that opens ten minutes late. And then, within seconds, a crowd that was merely large becomes a crowd that is dangerous.

    Anyone who has worked in public safety in India knows this story too well. It’s the story behind Sabarimala, behind Kumbh Mela, behind a hundred smaller temple towns whose names rarely make the news until something goes wrong. The tragic part is that these events are rarely unpredictable. The warning signs are almost always there hours before, sometimes days before. The real failure isn’t a lack of data. It’s a lack of a system that can read that data fast enough to matter.

    This is the story of how temple crowd management is changing from headcounts and hunches to real-time, AI-powered video analytics that can see a stampede coming before it starts.

    Why Indian crowd events are uniquely high-risk

    Start with the basics: scale. A single day at a major temple festival can pull in more people than most countries’ entire stadium circuits combined in a year. Sabarimala’s peak season, the Kumbh Mela, Rath Yatra in Puri, Durga Puja, pandals in Kolkata, Sawan Mela at Baidyanath, these aren’t crowds in the way a concert or a cricket match is a crowd. They’re moving cities.

    Now layer on the terrain. Temple architecture wasn’t built for modern crowd volumes. Narrow stepped corridors, single-entry sanctums, uneven ghats, low overhangs, all designed centuries before anyone imagined lakhs of people converging in a single day. Add monsoon mud, festival lighting that creates blind spots, and processions that mix pedestrians with vehicles, and you have a physical environment that was never engineered for the loads it now carries.

    Then there’s timing. Crowd events in India are rarely flat they spike. A specific auspicious hour (muhurat), the opening of a gate, an idol’s darshan window, a fixed train or bus schedule, all of these compress arrivals into narrow windows. A crowd that builds gradually over six hours is manageable. A crowd that arrives in a thirty-minute surge is a different problem entirely.

    And finally, the human element: devotion doesn’t queue politely. People push not out of malice but out of urgency, the fear of missing a darshan, a ritual, a moment. That emotional intensity is exactly what makes traditional crowd control — barricades and whistles — insufficient on its own.

    Put these four together, extreme scale, unforgiving terrain, compressed timing, and emotionally charged movement and you get why Indian crowd events sit in a risk category of their own. Generic occupancy monitoring built for malls or airports doesn’t transfer cleanly. The system has to be built for this specific problem.

    How crowd density is measured in real time

    This is where the shift from manual to AI-powered video analytics changes everything. Traditionally, crowd control relied on personnel stationed at vantage points, radios, and best-guess estimates “it looks packed near Gate 3.” That’s not a measurement. That’s an impression, and impressions arrive too late and too imprecise to act on.

    A modern occupancy monitoring system works differently. Existing CCTV feeds, the same cameras already installed for security are fed into computer vision models that continuously estimate crowd density per zone, not for the venue as a whole. Density isn’t measured as a single number for “the temple.” It’s measured corridor by corridor, gate by gate, courtyard by courtyard, because a stampede risk in one lane can exist while an adjacent lane is completely calm.

    The system tracks people-per-square-metre in each zone, along with the rate of change is this zone filling up faster than people are leaving it? That rate is often more predictive than the density number itself. A zone at 70% capacity but climbing fast is more dangerous than a zone sitting steady at 85%.

    This is the part that makes AI-powered video analytics genuinely different from a headcount: it doesn’t just tell you how many people are somewhere. It tells you how that number is moving, and whether the movement pattern itself looks safe. Flow direction, bottleneck formation, and dwell time in narrow passages all become measurable signals instead of things a stationed guard has to notice and radio in.

    Early-warning thresholds for stampede prevention

    Measuring density is only useful if it translates into a warning before the danger point, not at it. This is where stampede prevention becomes a design problem, not just a technology problem: what threshold triggers what response, and how early is early enough?

    The thresholds aren’t arbitrary. They’re built zone by zone, using the physical characteristics of that specific space, corridor width, number of entry/exit points, surface type, historical footfall patterns for that day of the festival calendar. A stretch of open courtyard can absorb a density that would be dangerous in a covered, single-exit corridor. Treating every zone with the same threshold is one of the most common mistakes in legacy crowd management and one of the easiest to fix with a zone-aware system.

    Crucially, the goal is a graduated response, not a single alarm. A well-designed system flags three tiers: a caution level (density rising, worth watching), a warning level (density approaching capacity, entry should slow), and a critical level (immediate intervention needed this is the stage no one wants to reach). The value of this staging is that it gives ground teams time to act at the caution and warning stages, when a gate closure or a diverted queue is a minor operational decision not a moment of crisis management.

    This is the essence of stampede prevention done right: the system’s job isn’t to report the emergency. It’s to make sure the emergency is prevented from happening in the first place, by surfacing the trend early enough that a small correction, not a large intervention is all that’s needed.

    Coordinating alerts with on-ground response teams

    An early warning that nobody acts on is just a notification. The real test of any occupancy monitoring system is what happens in the fifteen seconds after the alert fires.

    This is why crowd alerts need to be built around the people who will actually respond, police personnel, temple volunteers, event marshals not just around a control room dashboard. An alert that only lives on a screen in a back office does nothing for the volunteer standing at the gate where density is climbing. The alert needs to reach that person, at that gate, with a clear instruction: slow entry, redirect to the alternate path, hold the queue.

    In practice, this means integrating the alerting layer with existing communication channels, radios, WhatsApp groups, PA announcements  rather than asking response teams to learn a new tool during a live event. It also means giving control room operators a clear visual: which zone triggered the alert, what the current trend looks like, and what the recommended action is, so a decision can be made in seconds rather than minutes.

    Coordination also has to account for something very specific to Indian festival deployments: the response team is rarely a single organisation. It’s typically a mix of police, temple trust staff, local municipal officials, and volunteers, each with different communication habits and different authority to act. A crowd alert system earns its value not by being sophisticated, but by being simple enough that all of these groups can act on the same signal without confusion about who does what.

    Lessons from temple and festival deployments

    A few patterns repeat across deployments, and they’re worth stating plainly because they cut against some common assumptions.

    First, the busiest hour is rarely the most dangerous one. The highest-risk moments tend to occur during transitions, gate openings, the start of a specific ritual, the end of a procession, when a large, stationary crowd suddenly starts moving in one direction. Density-based monitoring that watches for these transition points, not just peak headcount, catches risk that a simple attendance count would miss entirely.

    Second, the same camera infrastructure that already exists for security purposes is usually sufficient for smart video analytics. Very few deployments require new cameras, most require better use of what’s already mounted on poles and gates. This matters practically: it means temple trusts and event organisers can adopt real-time crowd monitoring without a large new capital outlay, because the transformation happens at the software layer, not the hardware layer.

    Third, and perhaps most important: a system’s usefulness is measured by how boring the outcome looks. The best deployments don’t produce dramatic rescue stories — they produce quiet, uneventful festivals where a gate was closed ten minutes earlier than planned, a queue was split into two lines, and nobody outside the control room ever knew a threshold had been crossed. That’s what stampede prevention actually looks like when it works, not a dramatic intervention, but an invisible one.

    That, ultimately, is the shift underway in Indian crowd management: from managing crowds after they become dangerous, to seeing them clearly enough, zone by zone, minute by minute, that “dangerous” never gets the chance to happen at all.

    Conclusion

    None of this replaces the people on the ground, the police personnel, the volunteers, the temple staff who have managed these crowds for generations with nothing more than experience and instinct. What it does is give them something they’ve never had before: a clear, early, zone-by-zone view of what’s actually happening, in time to act on it.

    That’s the real promise of bringing AI-powered video analytics to temple and festival crowd management. Not a replacement for judgment, but a force multiplier for it, turning cameras that were only ever watching for security into a live safety net for the millions of people who show up, year after year, simply to be part of something they believe in. Getting that balance right, technology in service of tradition, not in place of it is what stampede prevention at scale actually looks like. Because the measure of success was never how well a system performs when things go wrong. It’s how quietly everything goes right.

  • Biometric Attendance Without New Hardware: Repurposing Office CCTV for Face Recognition Check-ins 

    Biometric Attendance Without New Hardware: Repurposing Office CCTV for Face Recognition Check-ins 

    Introduction 

    It’s 9:02 AM. Twelve people are standing in a line at the biometric device by the entrance, waiting to press a thumb that may or may not read correctly on the first try. Somewhere in HR, someone is about to open a spreadsheet to reconcile “device offline” errors from three different branches. This scene repeats itself every single morning, in almost every mid-sized company in India and most leadership teams have simply accepted it as the cost of tracking attendance. 

    But here’s the part that doesn’t get asked often enough: why does checking who’s present require a brand-new device at all, when there’s already a camera pointed at that same doorway? To see why that question matters, it helps to first look at what the “accepted cost” of attendance tracking actually adds up to. 

    The Cost Problem with Dedicated Biometric Devices 

    Traditional biometric attendance systems come with a familiar, if quietly expensive, shopping list: a fingerprint or face scanner at every entry point, wiring and mounting at each location, an on-premise controller or local server, and then the ongoing costs — device servicing, sensor replacement, and IT support tickets every time a reader stops recognizing chapped hands or a dusty lens. 

    Multiply that per door, per floor, per branch, and the math stops looking like a one-time purchase and starts looking like a recurring line item. For a company with five locations, that’s five sets of hardware, five sets of failure points, and five sets of “the machine is down again” complaints landing on HR’s desk. 

    Here’s the part that makes the whole setup feel unnecessary: most of these buildings already have CCTV cameras covering the exact same entry points the biometric device was installed next to. The camera was bought for security. The attendance device was bought separately, for time tracking. Two budgets, two vendors, two systems that don’t talk to each other, solving what is fundamentally one problem: knowing who walked in, and when. Which raises the obvious next question — if the camera is already there, what would it actually take to make it do this job too? 

    How Facial Recognition Attendance Software Works on Existing Cameras 

    That’s exactly where the shift happens. Instead of adding another box to the wall, face recognition attendance software runs as an intelligent layer on top of the CCTV feed that’s already there. No new drilling, no new device, no separate login for a separate machine, just software sitting on top of hardware that was doing something else a moment ago. 

    Here’s the flow, in plain terms: 

    1. Enrollment – Each employee’s face is registered once, creating a secure facial template (not a photo file sitting in a folder, but a mathematical representation used purely for matching). 

    2. Detection – As someone walks past the camera at the entrance, the software detects a face in the frame in real time. 

    3. Matching – That face is matched against the enrolled database within a fraction of a second. 

    4. Logging – A check-in (or check-out) timestamp is recorded automatically and pushed to the attendance dashboard — no card tap, no thumb press, no queue. 

    The camera itself doesn’t change. What changes is the intelligence sitting behind it, turning passive footage into an active, structured attendance log. For a business, this means the CCTV that was “just for security” starts doing double duty and the biometric attendance system effectively gets built on infrastructure that’s already paid for. Of course, the moment a camera starts recognizing faces automatically, a fair set of questions follows right behind it. 

    Accuracy, Speed, and Privacy Considerations 

    Naturally, the first question every ops or HR leader asks is: does it actually work as well as a dedicated device? And close behind that: is it safe to trust with people’s faces? 

    Accuracy — Modern face recognition attendance software is built to handle real-world office conditions: people wearing masks part of the year, glasses, changing lighting near glass entrances, and the general chaos of a morning rush. The matching engine is trained to account for these variables rather than needing a perfectly still, well-lit frame the way older fingerprint scanners needed a perfectly clean thumb. 

    Speed — Because there’s no physical contact step, check-ins happen as people simply walk through, the queue that used to form at a fingerprint device tends to disappear entirely, especially at shift-change times when dozens of people arrive within the same few minutes. 

    Privacy — This is the part companies should ask the most questions about, not the least. A responsible system should store facial data as encrypted templates rather than raw images, restrict access to who can view attendance data, and give the company full control over data retention and deletion. Any vendor proposing this kind of system should be transparent about exactly where that data lives and who can query it — this isn’t a “nice to have,” it’s the baseline for rolling out facial recognition responsibly in a workplace. 

    Get accuracy, speed, and privacy right at one location, and a second question follows almost immediately: what happens when this isn’t just one office, but ten? 

    Multi-Location Rollout: What Changes at Scale 

    A single office adopting this is a convenience upgrade. A company with ten or fifty locations is where the model really proves itself. 

    With traditional biometric devices, scale means replicating hardware and its problems at every site — new devices to procure, new local servers or controllers to configure, and IT tickets that differ from branch to branch depending on which device broke that week. 

    With a camera-based approach, scale looks different: 

    No new hardware procurement cycle for each new branch — if there’s a working CCTV camera at the entrance, the software layer can be extended to it. 

    Centralized visibility — attendance across all locations flows into one dashboard, instead of HR pulling separate exports from separate local devices. 

    Consistent enrollment — an employee who transfers between branches or covers a shift at another location doesn’t need to be re-enrolled on a separate physical device. 

    Faster rollout timelines — going live at a new branch becomes a software and configuration task, not a hardware installation project. 

    This is also where the time attendance software conversation starts overlapping with something bigger than attendance alone — the same camera network can, over time, support other use cases like footfall counting or safety compliance, without adding another layer of devices. But scaling the check-in itself only solves half the problem. The other half is what happens to that data once it’s captured. 

    Integration With Payroll and HR Systems 

    Attendance data is only as useful as what happens to it after the check-in. An attendance tracking software that sits in isolation, generating logs nobody exports on time — creates as much manual work as no system at all. In other words, the same disconnect that started this whole story (a camera and a device that didn’t talk to each other) can quietly show up again, this time between the attendance system and payroll. 

    The real fix is integration: attendance logs flowing directly into payroll for accurate salary and overtime calculation, automatic leave and shift reconciliation instead of manual matching at month-end, and real-time dashboards for HR and plant/floor managers to see who’s in, who’s late, and who’s absent, without waiting for an end-of-day report. 

    When a face recognition biometric attendance system is built to plug into existing payroll and HR workflows rather than requiring a parallel process, attendance stops being a standalone admin task and becomes a live data feed that the rest of the business can actually use. 

    The Bigger Shift 

    Which brings the story back to where it started: a line of people at 9:02 AM, waiting on a device that was never really necessary in the first place. None of this is about replacing one gadget with another, it’s about recognizing that the camera already on the wall was always capable of more than watching for security incidents. 

    For a company sitting on CCTV infrastructure it already paid for, the question isn’t whether to modernize attendance tracking. It’s why that infrastructure isn’t already doing it. 

  • Heatmaps for Store Layout: What 90 Days of Camera Data Taught One Retailer About Aisle Placement

    Heatmaps for Store Layout: What 90 Days of Camera Data Taught One Retailer About Aisle Placement

    Introduction

    When we manage online stores or websites, tracking where users get stuck is pretty simple. We look at click rates, check where people exit the page, and use digital heatmaps to see where they scroll. But in a physical, brick-and-mortar store, understanding how people move has always been a guessing game. For years, retail managers had to walk around with clipboards or rely on gut feeling to guess which aisles were working and which ones were ignored.

    Recently, a clothing and grocery retailer decided to change that. They took 90 days of video footage from the security cameras they already had installed and ran it through modern AI powered video analytics. By turning regular video into simple visual maps, they learned exactly how shoppers behave inside a store. Here is what that data revealed.

    What a Retail Heatmap Actually Shows

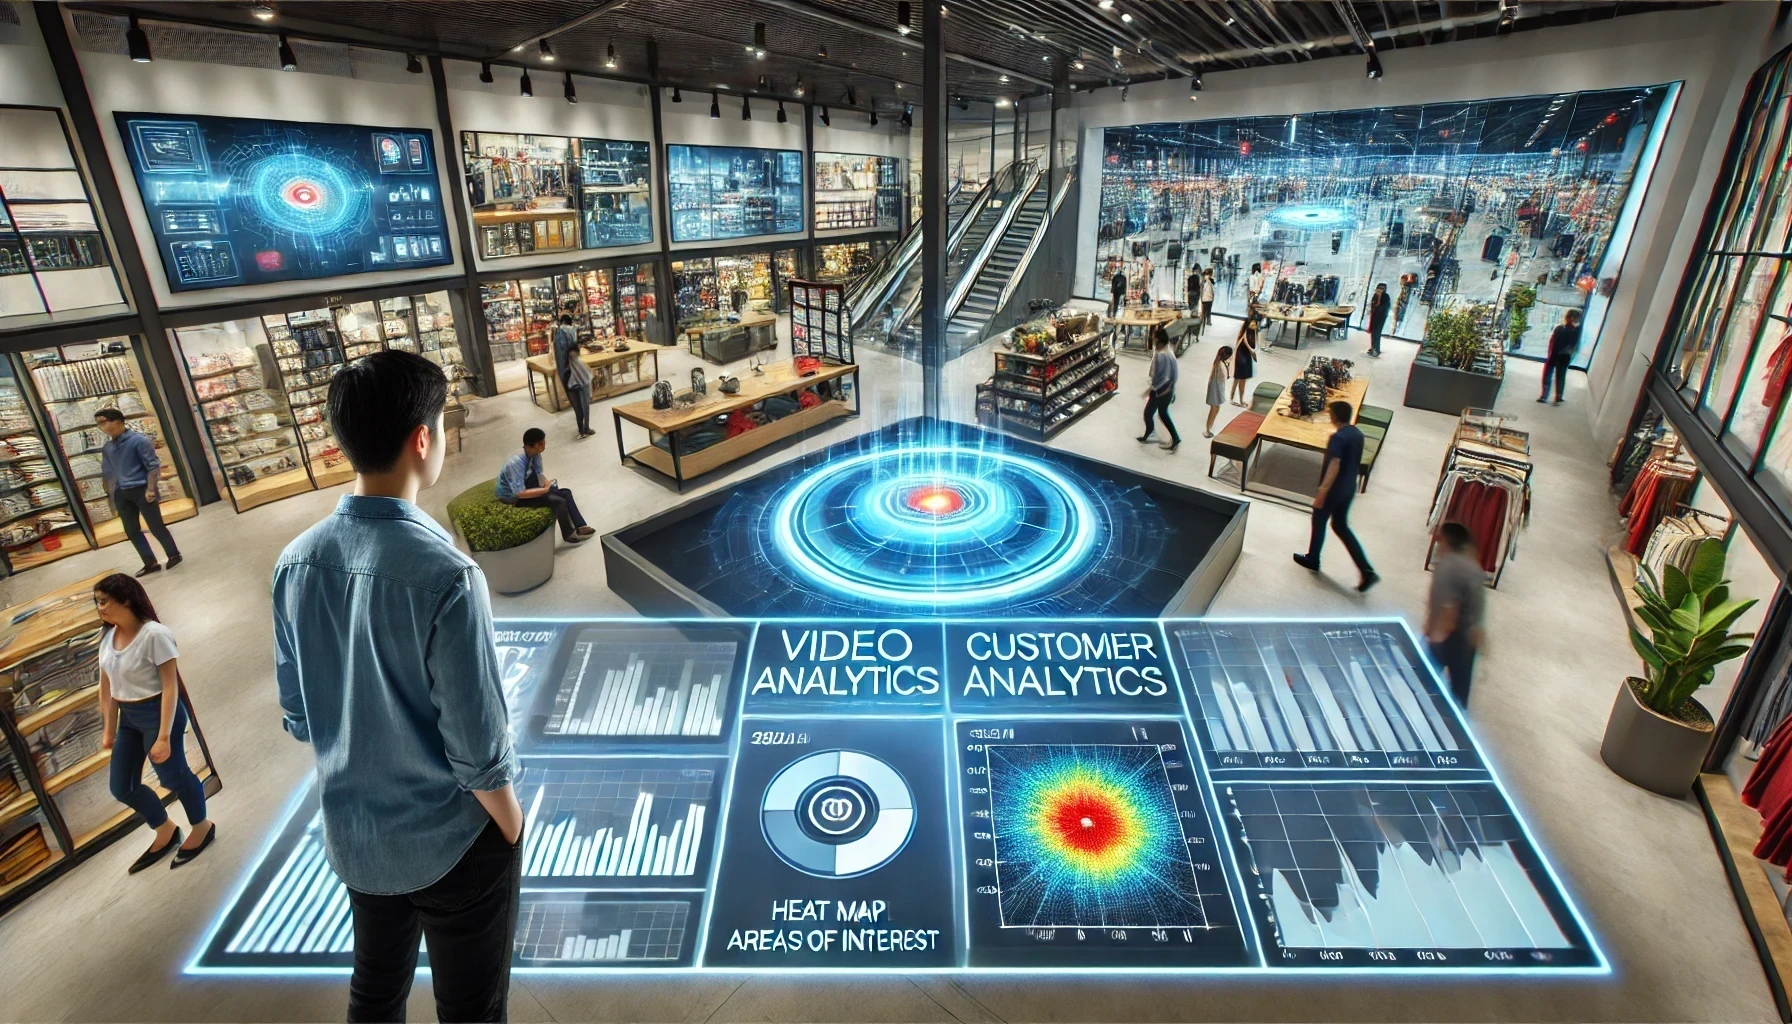
    A retail heatmap isn’t complicated. It’s just a colorful layer placed on top of a store’s map that shows where people walk and stand. While a basic retail footfall counter software at the entrance can only tell you how many people walked into the store, store analytics heatmap tools go much deeper. They track two main things: traffic volume (how many people pass by) and dwell time (how long they actually stop).

    The software securely tracks movement and turns time spent in an area into colors. Heavy traffic and long stops show up as “hot zones” (bright red and orange), while ignored spaces stay “dead zones” (cool blue). This gives brands a clear picture of customer journey analytics in retail without needing any fancy or expensive new gadgets.

    Reading Hot Zones vs Dead Zones

    When the retailer first looked at the data, they assumed every red spot was good and every blue spot was a failure. But they quickly realized that reading a heatmap requires understanding human psychology.

    For example, the biggest red hotspot on the map was right inside the main entrance. At first, it looked like customers were loving the products placed there. In reality, it was just a “decompression zone”—the space where people naturally slow down, adjust to the indoor lighting, and look around to figure out where to go next. They weren’t looking at the products; they were just orienting themselves.

    True hot zones are deeper in the store, where people actually stop to browse a shelf. On the other hand, blue dead zones showed exactly where the layout was failing—like corners where bad lighting or tight corners made shoppers turn around and walk away before even seeing the items.

    Case Study: The 90-Day Aisle Optimization Experiment

    To see how this data actually helps a business, let’s look at what this retailer did over 90 days. They used an in-store people counting system to track behavior across three distinct phases.

    Phase 1: Days 1-30 ➔ Find the bottlenecks and find out why the center aisle is empty.

    Phase 2: Days 31-60 ➔ Move displays, tilt shelves 45 degrees, and change product locations.

    Phase 3: Days 61-90 ➔ Check the new heatmap and see a 14% jump in foot traffic.

    During the first 30 days, the data showed a massive problem: almost 73% of customers completely ignored the middle aisle, which actually held the store’s highest-profit items. The heatmap revealed that a giant promotional display near the front door was blocking the view, forcing everyone to walk along the outer walls instead.

    On day 31, the manager made three simple changes based on the camera data:

    • They cleared the entrance zone, moving the big display stands deeper into the store so the view was wide open.
    • They turned the inside shelves at a 45-degree angle. This way, as customers walked down the main path, they could easily see inside the middle aisle out of the corner of their eye.
    • They moved everyday staple items (things people always buy) right into the center of that empty middle aisle to pull traffic into the dead space.

    By day 90, the data showed a complete transformation. Foot traffic into the center aisle jumped by 14%. More importantly, when they checked their daily sales numbers, they found that because people were spending more time in that high-profit aisle, the average amount spent per customer went up significantly.

    Measuring the before/after impact

    By day 90, the data showed a complete transformation across the floor plan. Foot traffic into the center aisle alone jumped by 14%, which completely changed the baseline movement of the entire store. But the real validation came when the store manager cross-referenced these new movement maps with their point-of-sale cash registers at the end of the week. They found a massive financial shift that matched the color changes on the screen. Because people were now taking their time and spending more minutes in that specific high-profit corridor instead of just rushing past it, the average basket size per customer went up significantly.

    Shoppers started picking up items they usually overlooked simply because they had the physical space and the visual angle to notice them. Instead of a few popular products carrying the bulk of the revenue, sales became much more evenly distributed across the entire shelf setup. The entire project proved that minor tweaks in physical design can trigger major changes in how people buy. In fact, the profit generated from those newly discovered conversions allowed the layout change to pay for itself in just a few weeks, turning a blind spot into the most profitable zone in the building.

    Common Mistakes When Interpreting Camera Analytics

    While using retail store performance analytics is incredibly helpful, it is easy to misinterpret the data if you aren’t careful.

    The biggest mistake is confusing a delay with actual popularity. For instance, a bright red spot would often appear right near the checkout counters. A quick look might make you think customers love that area. But in reality, it was just a long queue because the cash register was slow. Customers were standing still because they were stuck in line, not because they wanted to buy something. Treating a bottleneck as a “high-engagement zone” will ruin your data.

    Another mistake is trying to get rid of every single blue zone. A store needs “quiet” or empty space. Wide walkways, clear paths to emergency exits, and open areas near trial rooms are necessary to keep the store comfortable. If you crowd every square foot with products just to turn a blue zone red, you’ll make the store feel claustrophobic, and shoppers will leave faster.

    Ultimately, the gap between online tracking and real-world shopping is disappearing. The future of retail belongs to businesses that use simple video intelligence to understand physical shoppers just as clearly as website visitors. By keeping dashboards simple for managers on the ground, these smart tools easily become a natural part of running a successful everyday business.

  • Improving Zoo Security with AI Video Analytics

    Improving Zoo Security with AI Video Analytics

    Introduction

    Let’s be honest about managing a zoological park. It is a massive footprint to cover. Open-air enclosures, acres of wooded trails, wild animals, and thousands of distracted tourists walking around with cameras. Most zoos think they are safe because they have a central room full of CCTV monitors. But that is just a checklist item. Traditional cameras don’t look for risks; they just record the incident. If a visitor climbs a barrier or an animal slips out, you only find out after someone screams. That is passive logging, not safety.

    We need to fix this. Shifting to ai-powered video analytics isn’t about adding more screens. It’s about giving your existing grid a digital brain to flag anomalies before they turn into an operational crisis.

    Why Zoos Need AI-Powered Video Analytics for Modern Operations

    Human operators have a biological ceiling. Staring at a wall of 100 live camera feeds during a busy weekend shift is an impossible task. Within forty-five minutes, the eyes tire, shadows blend together, and critical movements get missed. It isn’t a training issue; it’s human fatigue.

    Relying on a guard to spot a boundary breach in real-time is a gamble. Integrating smart video analytics into your park operations removes this element of luck. The software scans every single zone across all feeds simultaneously, 24/7. It provides an objective layer of tracking that doesn’t get distracted by a text message or a long shift.

    Enhancing Zoo Security with Smart Video Analytics

    Standard motion sensors fail in a zoo environment. Trees sway, birds fly across lenses, and stray rodents trigger false alarms constantly. Eventually, operators start ignoring the pings because 99% of them are noise.

    Advanced smart video analytics solves this through precise object classification. The system understands the difference between a falling leaf and a human shape entering a restricted holding bay. By filtering out the environmental noise, your security team stops chasing ghosts. They only deploy when the AI flags a genuine, verified perimeter breach.

    Using Camera Analytics to Monitor Animal Enclosures Effectively

    The safety railing around a high-risk enclosure is a strict boundary, but visitors ignore it constantly. People lean over for selfies, drop personal items, or set their kids on top of the walls for a better view.

    By applying camera analytics to the enclosure feeds, you can create invisible, non-negotiable safety zones:

    • Buffer Zone Intrusion: The software automatically flags if a person steps off the pedestrian path into the stand-off area.
    • Barrier Proximity: It counts the seconds a human shape remains stationary on top of a protective fence line.
    • Proactive Warning: It pings the nearest floor marshal before the person actually drops or climbs inside, turning a potential disaster into a quick verbal correction.

    Real-Time Safety Alerts for Visitors, Staff, and Animals

    When a crisis happens on a 50-acre property, communication delays are your biggest enemy. If an altercation occurs at a crowded food court or a handler faces a lock-in issue, relying on someone to make a radio call takes too long.

    Our system tracks physical disruptions like active fights or sudden crowd surges based on pure structural movement data. The moment a physical conflict or a barrier breach is detected, the platform triggers immediate safety alerts. These bypass the slow, traditional chain of command and hit the smartphones of the closest response rangers instantly, complete with exact coordinates.

    How Fall Detection Systems Improve Emergency Response in Zoos

    Uneven stone paths, wet boardwalks, and steep steps near aquatic exhibits are major trip hazards. In a sprawling park, if an elderly visitor or a lone staff member falls on a secluded trail, they could lie there for an hour before being found.

    This is where a dedicated fall detection algorithm becomes vital. It tracks human posture in 3D space. The second a person’s skeletal frame drops from vertical to horizontal and stays down, the AI registers a fall. An automated alert goes to the medical desk immediately. Slashing the discovery time down to seconds is critical for handling heatstrokes or sudden cardiac arrests on hot summer days.

    Real-World Use Case: The Maintenance Moat Fall

    Imagine a keeper working near an open enclosure moat during off-hours. They lose their footing and fall down the concrete incline, landing out of the direct sight of main paths. The fall detection software captures the sudden downward momentum and the prone posture within milliseconds. It bypasses the need for a manual check-in, routes an emergency notification to the rescue crew, and ensures the injured worker is pulled out safely.

    AI Video Analytics for Better Animal Behavior Monitoring and Care

    Wildlife safety goes beyond visitor gates. Animals are experts at hiding symptoms of injury or stress when human handlers walk into their enclosures. It’s a basic survival instinct.

    Continuous tracking via camera analytics allows veterinary teams to monitor animal behavior without creating human stress:

    1. Stereotypic Pacing: Automatically logs if an animal starts repetitive, compulsive movement loops that indicate stress.
    2. Resource Guarding: Tracks if a specific animal is being bullied or blocked from food troughs by dominant group members.
    3. Maternity Support: Provides zero-disturbance monitoring for pregnant or newborn animals, ensuring they are resting safely without needing constant, intrusive physical checks.

    Future of Zoo Management with Intelligent Surveillance Solutions

    The era of isolated security setups is over. Modern facility management is about connecting your camera analytics directly into your public information systems.

    The future of smart zoos involves linking an ai-powered video analytics framework directly with digital park signage. If the primate exhibit hits peak capacity, the system automatically updates the entry billboards with current wait times and suggests alternative, less-congested paths across the park. This kind of data-driven coordination doesn’t just keep people safe; it optimizes the entire visitor experience. Enalytix turns passive CCTV feeds into an active, thinking safety asset, ensuring your park runs seamlessly at the speed of data.

  • Smart Surveillance Solutions for Tourist Safety at Popular Public Attractions

    Smart Surveillance Solutions for Tourist Safety at Popular Public Attractions

    Introduction

    Let’s be realistic about iconic tourist destinations. Whether it is a historic fort, a scenic viewing point, or a crowded public monument, managing thousands of excited visitors simultaneously is a massive operational hurdle. For decades, authorities have relied on traditional CCTV networks. But regular cameras are passive. They just record the crowd bottlenecks, the perimeter slips, or the emergency incidents so you can review the footage after the damage is done. That isn’t public safety; it’s just a digital post-mortem.

    We need a proactive approach. The shift towards an automated video intelligence solution is about moving from “watching a crisis” to “preventing a disruption.” AI cameras change the entire setup by giving security teams an objective, continuous layer of oversight that protects travelers while keeping the operational flow smooth.

    Why Tourist Attractions Need Smart Surveillance Systems

    The sheer scale of popular landmarks means manual human monitoring hits a physical ceiling very quickly. A small team of operators sitting in a control room cannot realistically watch 200 live camera feeds simultaneously during peak holiday seasons. Human fatigue is a biological reality; it sets in within an hour. When that happens, structural anomalies, unauthorized access, or minor entry gate delays pass by unnoticed simply because there is too much visual data for human eyes to process.

    Manual tracking often comes down to pure luck, whether an operator happens to look at the right screen at the exact right second. Embedding advanced AI tools directly into the landmark infrastructure fixes this loophole. The system processes every active zone across all connected feeds at the same time, acting as a non-stop safety net.

    Enhancing Public Safety with AI Video Surveillance

    Modern ai video surveillance doesn’t just record video; it understands the physical boundaries of a space. By utilizing deep-learning algorithms, the system can track vehicular and pedestrian movement patterns simultaneously without any human bias.

    Real-World Use Case: The Viewing Deck Flow Management

    Imagine a popular hill-station viewpoint or a historical monument balcony. A standard camera setup requires a manual guard to constantly guess the crowd size. An Enalytix-driven system, however, uses precise zone-based crowd counting. Authorities can set a strict numerical capacity limit for that specific deck. The moment the live headcount crosses the safe threshold, the system flags the congestion instantly. This allows floor marshals to temporarily pause entry at the access gates, maintaining an orderly and safe visitor flow before the deck becomes uncomfortably overcrowded.

    Using Crowd Alerts to Prevent Overcrowding at Tourist Destinations

    High tourist influx is great for the local economy, but managing dense crowds outside ticketing counters or narrow entry arches is a major logistics challenge. Extended wait times cause queues to become disorganized, which quickly creates friction and pedestrian blocks on the floor.

    Our specialized analytics systems assist administrative teams by reading crowd dynamics in real-time. The AI calculates the exact density per square meter. If a pathway begins to show signs of heavy congestion, the software triggers automated crowd alerts. This gives ground staff and local authorities an early indicator to step in, organize the lines, and temporarily regulate the entry gates to keep the movement smooth.

    Occupancy Monitoring Systems for Better Visitor Management

    Knowing exactly how many people are inside a specific zone is critical for micro-management. Traditional methods rely on manual gate turnstiles, which fail if people bypass the gates or enter through exit routes.

    An intelligent occupancy monitoring system solves this by tracking the physical chassis of visitors across multiple entry and exit points simultaneously.

    • Live Headcounts: Keeps an exact count of people inside closed museum halls or historical rooms.
    • Over-Capacity Preventions: Automatically alerts the team when a section hits 90% of its safe capacity.
    • Asset Allocation: Helps authorities deploy extra ticketing staff or medical assistance to the exact zones where the tourist volume is highest.

    How AI Helps in Stampede Prevention at Public Attractions

    In high-density public spaces, a sudden panic can lead to a stampede within minutes. Humans are bad at estimating crowd forces during a rush, but AI models can spot the early signs of physical compression.

    Our stampede prevention framework looks for “flow counter-currents.” If a massive crowd is moving forward and a small group suddenly tries to run backward due to panic, the AI detects the structural friction instantly. It doesn’t rely on tracking vague intent or body language; instead, it tracks the rapid, chaotic physical displacement of the crowd. This allows authorities to open emergency exit gates and broadcast automated public announcements to steer the crowd safely, preventing a crush before it can form.

    Real-Time Safety Alerts for Faster Emergency Response

    Physical altercations, medical crises, or accidental slips on historical steps happen in seconds. In a dense crowd, a person who has collapsed can go unnoticed by ground guards for vital minutes.

    The system is explicitly trained to spot the distinct physical parameters of active disruptions and falls. The moment a physical conflict or a sudden human collapse onto the floor is identified, the system triggers immediate safety alerts. These notifications bypass traditional slow chains of command and go straight to the smartphones of nearby first-aid responders and security personnel with exact location coordinates.

    Real-World Use Case: The Waterfront Perimeter Protection

    Consider a popular lakeside, riverside, or beach front where safety boundaries are marked. Instead of waiting for a visitor to accidentally venture too deep or cross into dangerous zones, Enalytix deploys virtual tripwires directly onto the camera feed along the safety line. If a tourist steps over the designated safety perimeter or enters a restricted water boundary, the system registers a boundary breach instantly. An automated alert pings the on-ground security or lifeguard station immediately with the exact zone location, allowing for rapid verbal intervention before an actual emergency occurs.

    Future of Smart Tourist Safety with AI-Powered Surveillance Solutions

    Modern tourism is evolving toward a fully smart, data-driven experience. The future of secure public landmark management relies heavily on advanced ai video surveillance capabilities to support public administrators.

    We are looking at deep integrations where an automated occupancy monitoring system can communicate directly with digital signage outside the monument gates, informing arriving travelers about current wait times and alternative less-crowded paths in real-time. With Enalytix, turning passive camera data into an intelligent safety asset helps authorities conduct smooth, safe, and highly organized visitor management. We turn standard cameras into active, thinking protectors to make “Zero-Incident” public attractions a reality.